CASE FILE 01 / 2026 / LEAD FRONTEND
NEXUS — REALTIME GRAPH.
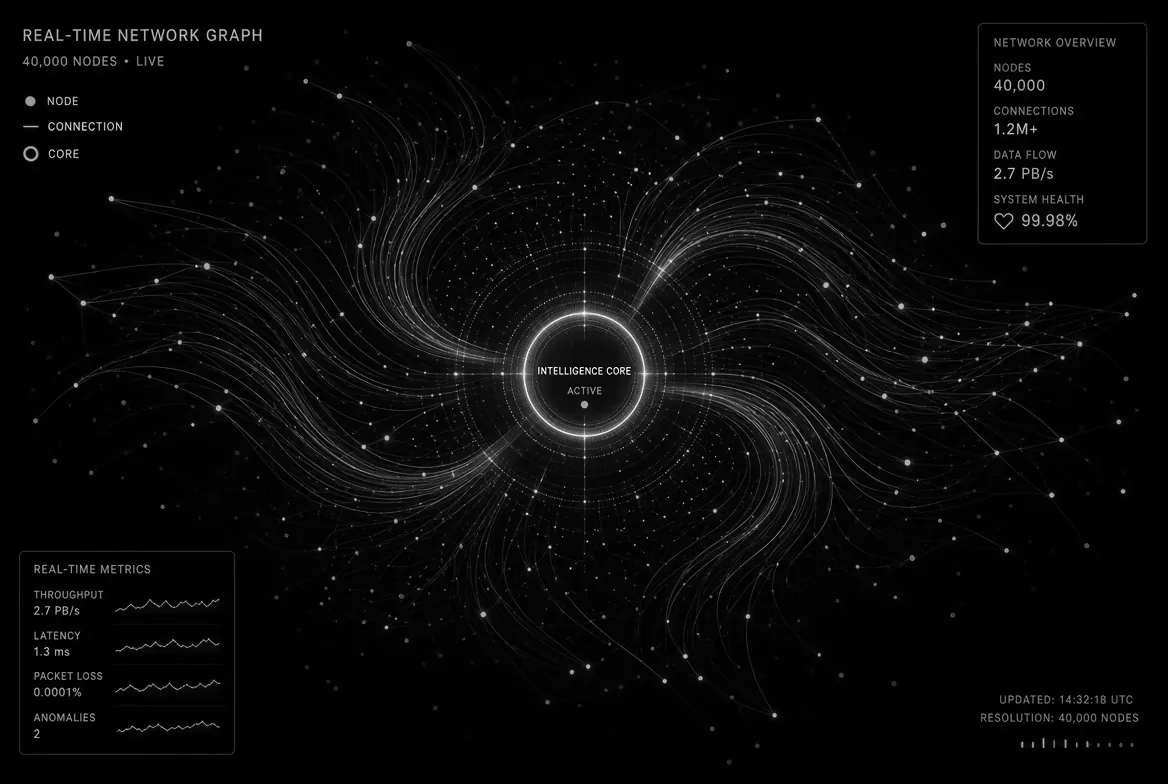
An analytics platform for infrastructure teams. The brief was a live dependency graph of roughly forty thousand nodes that stays readable and stays at sixty frames per second while the data underneath it keeps moving.
//The constraint#
Forty thousand nodes is the number where the obvious approaches stop working. Rendering each node as a DOM element is out immediately. Canvas 2D gets you to roughly four thousand before the main thread starts missing frames. And the data isn't static: nodes appear, health states flip, edges re-route, all arriving over a socket at up to twelve updates a second during an incident — which is exactly when the tool has to work.
//What I built#
Geometry moved to the GPU as instanced quads, one draw call for all nodes and one for all edges, with position and colour packed into a texture that the shader reads per instance. Updating a thousand nodes became a partial texture write rather than a thousand object mutations. Layout ran in a worker on a fixed thirty-hertz tick, independent of the render loop, so a heavy relayout could never stall a frame.

Labels were the harder half. Text in WebGL is either expensive or ugly, so labels stayed in the DOM — but only the forty or so that are legible at the current zoom, recycled from a fixed pool and positioned from the same projection matrix the shader uses.
//Result and regrets#
Sustained sixty frames per second on a 2019 ThinkPad with integrated graphics, and around forty on mid-range Android. Interaction to paint on a node selection landed under sixteen milliseconds. What I'd change: I built a custom force layout before checking whether a simpler hierarchical one would satisfy the actual use case. It would have, and it would have cost three weeks less.
